1. INTRODUCTION
The Centrally Sponsored Plan scheme “Rationalisation of Minor Irrigation Statistics (RMIS)” was launched in 1987 with cent percent Central assistance to the State/Union Territories. The aim of RMIS scheme is to build a comprehensive and reliable database in Minor Irrigation Sector for future planning. The major activity under the scheme is the All India Census of Minor Irrigation conducted quinquennially in states covering all ground water and surface water Minor Irrigation schemes.
The first census of Minor Irrigation schemes with reference year 1986-87 was conducted in the States/Union Territories and the report was published in November 1993. The second census with reference year 1993-94 was initiated in September 1994 and the report was published in March 2001.The information in respect of adoption of newly developed technology of Water and Energy Conserving Devices such as Sprinkler and Drip Irrigation System and use of Non Conventional Energy sources such as solar pumps and wind mills was collected in this round. The census data was computerized with the help of National Informatics Centre and the results were put on Web Site of the Ministry of Water Resources, Government of India. The 3rd census of M.I. Schemes with reference year 2000-2001 has been conducted in 33 States/Union Territories. The report has been released in November 2005. The data collected in the Census is utilized for formulation of proposals for the five Year Plans. The census data is also utilized for estimation of Ground Water Resources by the State Water Investigation Directorate (SWID) under Department of Water Resources Investigation and Development (DWRID), Government of West Bengal in collaboration with Central Ground Water Board (CGWB), Government of India. In addition to this, Central Water Commission and various Wings under Ministry of Water Resources, etc. use the Census data extensively.
The 4th Census of Minor Irrigation Scheme has been conducted with reference year 2006-07. The fieldwork of the census has been taken up from the month of July 2007. This census would help to update the data base pertaining to the M.I. Structures and make a fresh assessment about the actual irrigation potential created and its utilization, which is essential for estimating the availability of water resources and drawing up realistic plan and programme for further development in the minor irrigation sector. The Department of Water Resources Investigation & Development (DWRID), Government of West Bengal would be the nodal department to conduct the Minor Irrigation Census and the Principal Secretary, Department of Water Resources Investigation & Development (DWRID) would act as the Minor Irrigation Census Commissioner.
2. SCHEDULES OF ENQUIRY
In this census, three types of schedules were prescribed:
(i) Village schedule,
(ii) Schedule for ground water scheme and
(iii) Schedule for surface water schemes.
The village schedule contains information about the village as a whole, ground water schedule contains data on ground water schemes namely dug well, shallow tube well and deep tube well and the surface water schedule contains surface flow and surface lift irrigation schemes. The Census data was collected through canvassing enumeration schedules for each minor irrigation scheme. The information in village schedule pertaining to some general information of the village was canvassed by the enumerators through enquiry from Gram Pradhans, etc. and/or from the revenue or land records maintained in the Government office. The scheme oriented schedule was collected by enumerators through enquiries from the owners of the scheme. While most of the items were quantitative in nature, a few questions were added for getting general information also. In case of institution owned Minor Irrigation works, it will be necessary to verify the information from available records also.
3. METHODOLOGY
The census data has been collected through canvassing i.e. filling up enumeration schedules or proforma. Unlike six enumeration schedules used in the 3rd Minor Irrigation Census, only three schedules have been prescribed in the 4th Minor Irrigation Census. The present Village Schedule contains more or less same items as was in 3rd Minor Irrigation Census –only layout has been modified. The village schedule was filled up by the enumerators through enquiries from Prodhans of the Gram Panchayats and the revenue or land record maintained in the office of the concerned Government Authorities and Organisations. The other two schedules relate to M.I. Schemes from Ground water and Surface water resources respectively were filled up by the enumerators through enquires from the owners of the scheme. These Minor Irrigation Schemes from ground water include dug wells, shallow tube wells (including LDTWs & Hand Tube wells for irrigation), deep tube wells (i.e. DTW, MDTW, HDTW), whereas Surface water Schemes include Surface Flow Irrigation Scheme and Surface Lift Irrigation Schemes.
In the 3rd Census, 5(five) separate schedules were prescribed for each type of schemes i.e. three types of ground water schemes and two types of Surface Water Schemes. Same type of ground water /surface water schemes could be recorded one after another in the same enumeration sheet. In the 4th M.I. Census, each enumeration sheet for ground water/surface water schedules is for one scheme only.
3.1 FIELD WORK
The enumerators would carry out the primary work of collection of data. The operational staffs of the deep tube wells, SOSTWs and R.L.I.s under DWRID were appointed as enumerators. Any other categories of Group ‘C’ staff were appointed as enumerators by the concerned Executive Engineers. Ordinarily one enumerator was appointed for not exceeding five mouzas/villages.
Allocation of blocks against the Executive Engineers of the district was made by the concerned Superintending Engineers declared as coordinators of the districts in consultation with the State level Trainers. The list of coordinators is indicated below:-
| Sl. No. | Co-ordinators | Jurisdiction (Districts) |
| 1. | S.E.(A-I),Bankura(A-I) Circle | Purulia, Bankura |
| 2. | S.E.(A-M), Midnapore (A-M) circle | Purba & Pashchim Midnapore |
| 3. | S.E.(A-M),Burdwan(A-M)Circle | Burdwan & Birbhum |
| 4. | S.E.(A-I) Kolkata(A-I) Circle | North & South 24-Parganas, Howrah, Hooghly |
| 5. | S.E.(A-I), Raiganj (A-I) Circle | Uttar & Dakshin Dinajpur, Malda |
| 6. | S.E.(A-M),Siliguri (A-M) Circle | Darjeeling, Jalpaiguri & Cooch Behar |
| 7. | S.E.(A-M),Berhampore (A-M) Circle | Murshidabad |
| 8. | S.E.(A-I) Krishnagar(A-I) Circle | Nadia |
These Executive Engineers was entrust the work of supervision of the census to the sub-division level officers, who would conduct frequent site visits in order to ensure the correctness of data recorded by the enumerators. The Executive Engineers also made arrangements to collect the schedules, list of existing block codes, mouza codes, instruction sheets for the enumerators and guidelines etc. from the office of the Director, SWID and distribute them to the enumerators under their control.
The sub-divisional officers received the filled up schedules and the village schedule from the concerned enumerators. They prepared mouza wise complete sets of different schedules for his jurisdiction and submitted them to the concerned Executive Engineer.
3.2 TRAINING PROGRAMME
Four teams of State level trainers were formed to impart training at the district Level. All the relevant details pertaining to census was discussed for training of these officers, at workshop organized in Kolkata. These officers, in turn imparted training to the Executive Engineers and Assistant Engineers at the district level training programmes organized in different districts under the chairmanship of the concerned Superintending Engineer, who had been declared as the coordinator in respect to census for the district. Finally, the concerned Executive Engineers provided training to the enumerators and the supervisory personnel.
3.3 FIELD LEVEL ENUMARATION
The field level enumerators were trained in respect of concepts and definitions. It was prescribed that necessary measures should be strictly followed in connection with supervision and checking. Accordingly, district level officers verified and inspected the process of field level enumeration and computerization.
3.4 COMPUTERISATION
For the processing of data, the National Informatics Centre (NIC), Government of India has developed the software to be used for data validation and tabulation and the same has been sent to Minor Irrigation Census Commissioner. Separate guidelines were issued for processing the data. Computerization of the census data involved handling of huge records. It was decided to take up the computerization of data at the District Headquarters as that was done in case of 3rd M.I. Census. The Executive Engineers were overall in charge of computerization of census data, in respect of the blocks allotted to them. WEBEL was engaged to computerize the enumeration schedules according to the software provided by NIC in the office of the Executive Engineer, WRDD in their own PC.
CDs containing validated data, collected during the census on primary enumeration schedules were prepared and after duly ascertaining the correctness of data, CDs were passed to the Director, State Water Investigation Directorate (SWID) by the concerned Executive Engineers of the Districts for State level Compilation.
3.5 CODES OF DISTRICTS, BLOCKS AND VILLAGES
As per the methodology of coding adopted during the third census, each mouza was identified by nine (9) digit code. The first 2 (two) digits denote the State,the next 2(two) digits denote the district, the next 2 (two) digits denote the block and the last 3(three) digits denote the mouza. The State Code for West Bengal is denoted as 28.
The district codes for West Bengal will be as follows:
| 01. | Bankura | 07. | Hooghly | 13. | North 24-Parganas |
| 02. | Bardhaman | 08. | Jalpaiguri | 14. | Pashchim Medinipur |
| 03. | Birbhum | 09. | Koch Behar | 15. | Purba Medinipur |
| 04. | Dakshin Dinajpur | 10. | Malda | 16. | Purulia |
| 05. | Darjeeling | 11. | Murshidabad | 17. | South 24-Parganas |
| 06. | Haora | 12. | Nadia | 18. | Uttar Dinajpur |
4. ADMINISTRATIVE APPROVAL
Granting of Administrative approval and financial sanction for provisional payment of grant to the State of West Bengal during 2006-2007 for conducting the fourth Census of Minor Irrigation Schemes with reference year 2006-2007 was issued vide No. 4-29/2006-MI(Stat)/642-51 under Centrally Sponsored Schemes- Rationalisation of Minor Irrigation Statistics by Ministry of Water Resources, Minor Irrigation Division, Government of India with an estimated cost of Rs.181.17 Lakh. It was decided that the Chief Engineer-I, WRDD would issue LOC to his Executive Engineers for making payments towards honorarium, contingency and data entry at stipulated rates and the Director, SWID would issue the Letter of Credit (LoC) to his Executive Engineers for making payments towards contingency, such as printing of formats, etc.
5. FINDINGS OF FOURTH MI CENSUS
Summary of the findings of cumulative performance of Fourth Census of Minor Irrigation Schemes in State Sector of West Bengal with structure wise breakup have been depicted below.
| Highlights of basic information | |||
| Sl.No. | Type of Structure | No. of Structures | Culturable Command Area (ha) |
| 1. | DugWells | 12467 | 25468 |
| 2. | Shallow Tube Wells | 501776 | 1413199 |
| 3. | Deep Tube Wells | 5196 | 198357 |
| Ground Water Schemes | 519439 | 1637024 | |
| 4. | Surface Flow | 29869 | 325001 |
| 5. | Surface Lift | 48753 | 403552 |
| Surface Water Schemes | 78622 | 728553 | |
| Total M.I. Schemes | 598061 | 2365577 | |
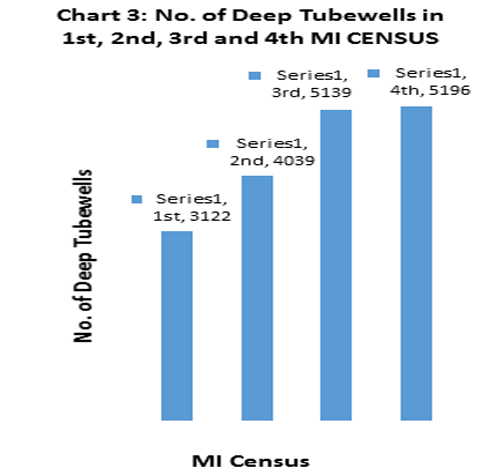
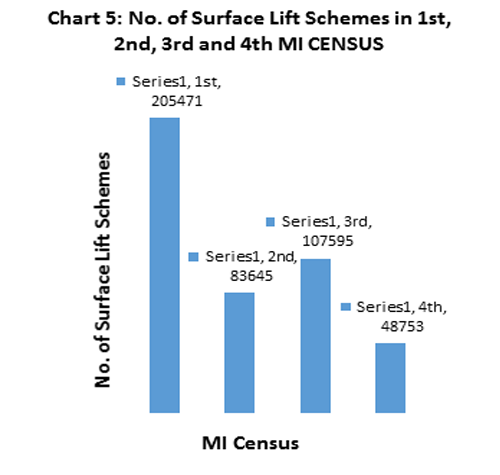
Compilation revealed information on 12467 numbers dugwells, 501776 numbers Shallow Tube Wells, 5196 numbers Deep Tube Wells, 29869 numbers Surface Flow schemes and 48753 numbers Surface Lift irrigation schemes i.e total 598061 numbers schemes which are quiet below the result found in earlier census (Referred to Chart 1 to 5).


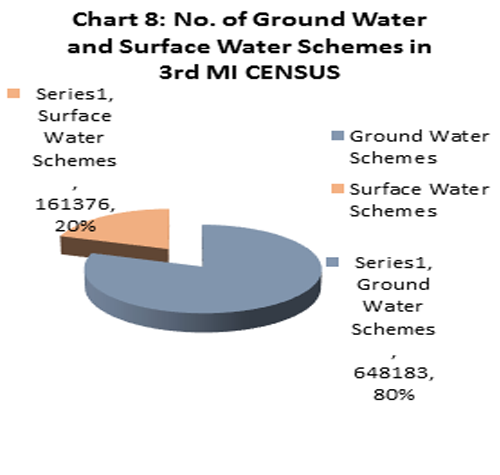
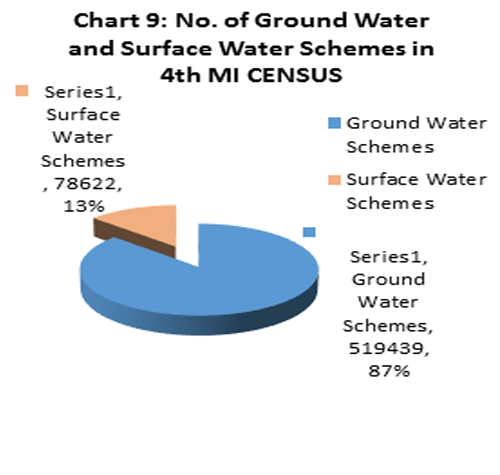
Comparing the data of 4th M.I. Census, it is observed that the percentage of Ground water Schemes has increased to 87% (Referred to Chart 6 to 9).


Culturable Command Area (CCA) and Minor Irrigation Potential have been increased with respect to earlier census by 12.87% and 5.7% respectively. The CCA of Surface water schemes are successively reducing though lift irrigation schemes comparatively increasing its performances. Comparison among four Minor irrigation censuses has been depicted in Annexure- I.
The possible reasons for the drop in numbers of ground water and surface water structures may be attributed to the following:
* Due to falling trend of ground water level as well as decrease of ground water discharge, dug wells are drying up, so there is gradual decrease in no. of dug wells. After having a comprehensive look on district wise data set of 3rd MI Census, it is seen that nos. of dug wells have been decreased in Bankura,Puruliya,Pashchim Midnapore and in Koch Behar districts. But CCA as well as Irrigation potential created per unit dug well has been increased which perhaps due to introduction of pumped dug wells.
* Due to indiscriminate sinking of shallow tube wells, there is sharp rise in no. of shallow tube wells since 3rd M.I.Census but it resulted in falling of ground water table and farmers had to switch over to submersible pump instead of centrifugal pumps. As a result, nos. of shallow tube wells has decreased .In the districts of Bankura, Barddhaman, Birbhum, Malda, Murshidabad, there is a declining trend of depth to ground water level. But it is noticed that CCA as well as Irrigation Potential per unit Shallow Tube well has been increased which perhaps due to deployment of high horse power pump set with increased head.
* Numbers of Deep Tube Wells has increased though marginally. It appears that numbers of structures enumerated in earlier census were not classified properly which were depicted as DTW in place of STW fitted with submersible pumps i.e. Light Duty Tube Wells (LDTW), mostly in Purba Midnapore and Jalpaiguri districts. In this context, it has to be admitted there were some confusion about the definition of tube wells among the enumerators which resulted in some anomaly in the previous census.
* In case of surface water structures, there is a major decrease in surface flow structures and surface lift structures. This has happened due to the fact that such schemes enumerated in earlier census have become derelict and non-existent. This also reveals the fact of degradation of surface water bodies due to silting and lack of maintenance. Though so many works have been taken up under NREGS such as surface water new tanks, renovation of tanks perhaps has not been reflected. Surface Flow schemes have been reduced considerably in the districts of Bankura, Birbhum, Puruliya and Murshidabad.
* In surface lift schemes, the device of lifting water is movable in nature, so numbers of schemes cannot be enumerated with accuracy and anomaly occurs. Surface Lift Irrigation schemes have been reduced considerably in the districts of Barddhaman, Hugli, Pashchim Midnapore, South 24-Parganas and Dakshin Dinajpur.
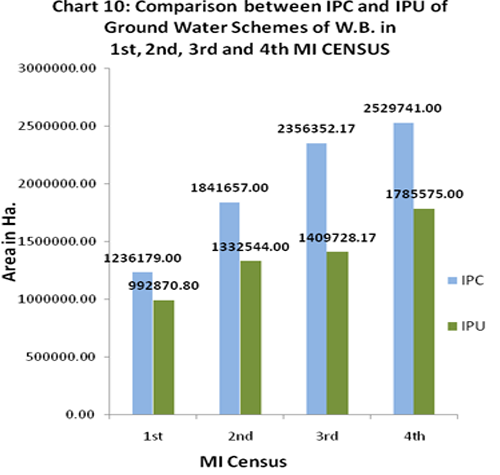
Irrigation Potential Created (IPC) of ground water schemes has increased due to increase in ground water utilization in irrigation sector. The analysis shows 71% potential utilized over potential created, which is more than that from the earlier Census (Referred to Chart 10).
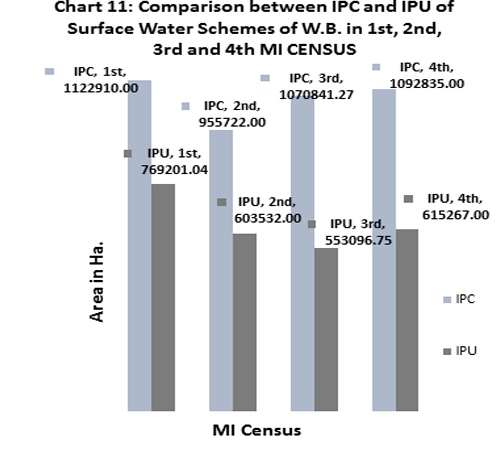
Irrigation Potential Created (IPC) of surface water schemes has decreased in 2nd M.I. Census compared with the 1st M.I. census, but gradually increased in the 3rd and 4th M.I. Census. Irrigation Potential Utilised (IPU) of surface Water Schemes has decreased from 1st to 3rd M.I. census and increased in 4th M.I. Census compared with 2nd and 3rd M.I.Census. (Referred to Chart 11).
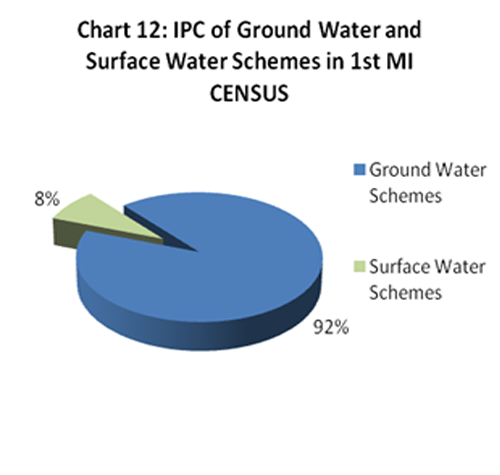
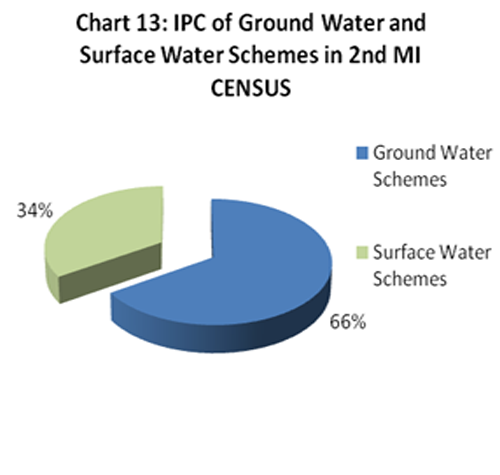
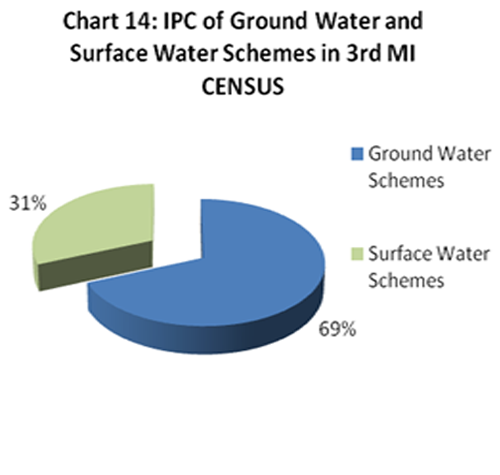
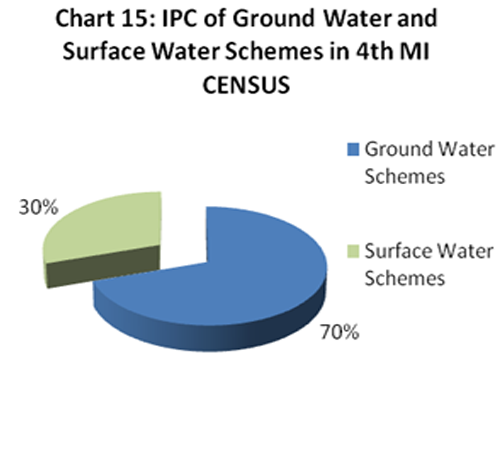
It is observed that the percentage of Irrigation Potential Created (IPC) of ground water schemes has increased from 2nd to 4th M.I. Census but less compared with 1st M.I. Census. In Surface Water Schemes percentage of Irrigation Potential Created (IPC) has been decreased than 2nd ,3rd and 4th M.I. Census (Referred to Chart No. 12 to 14).
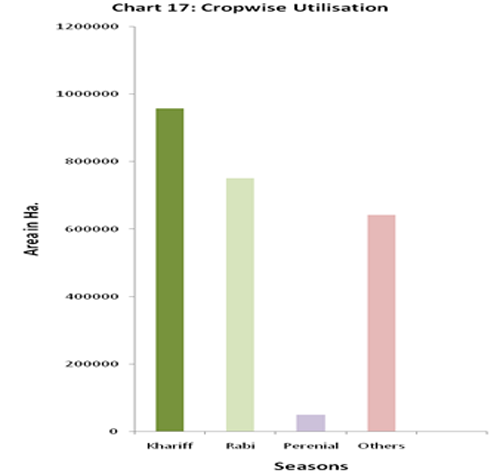
Area under Boro has been increased by 33.15% compared to 3rd MI Census. The graph shows that the area of Boro crop has been irrigated mainly using ground water from Shallow Tube Wells (Referred to Chart 17).

In West Bengal, the distribution of area under utilization during different agricultural season is shown in the chart below (Referred to Chart 17).
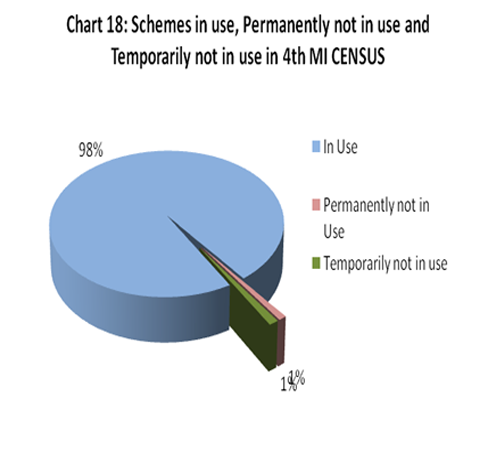
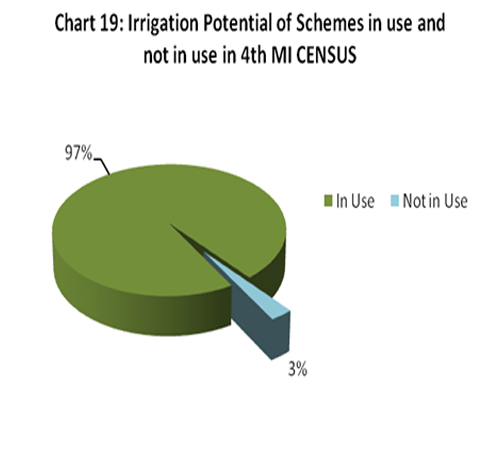
The 4th M.I. Census reveals out of 5,98,061 numbers schemes 98% schemes are in use, 1% schemes are permanently not in use and rest 1% schemes are temporarily not in use. In respect to Irrigation Potential, 97% potential has been contributed by the schemes which are in use (Referred to Chart 18 and 19).
Loss of Irrigation Potential has also occurred due to under utilization of schemes as observed through the difference of IPC and IPU. A study had been done to identify the reasons of under utilization and to find out the solutions to increase the loss in potential creation. In 4th M.I. Census, out of 6919 numbers under utilized ground water schemes, 19% are under utilized due to inadequate Power supply, 19% due to mechanical breakdown, 17% due to less water discharge and 45% due to other reasons. (Referred to Chart 20).

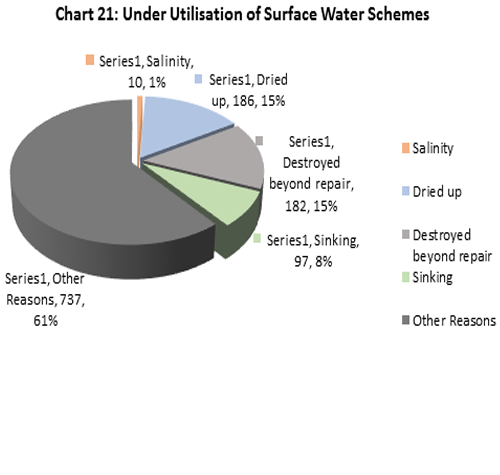
Out of 1212 numbers under utilized surface water schemes, 15% are under utilized due to dried up, 15% due to destroyed beyond repair, 8% due to sinking, 61% due to other reasons and 1% due to salinity (Referred to Chart 21).
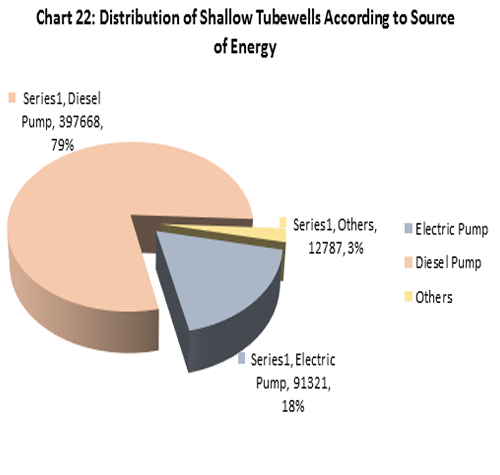
A study has been made on operation of Shallow Tube Wells to identify the source of energy. As per 4th M.I. Census 79% Shallow Tube Wells are operated by diesel pump, 18% by electric pump and 3% by other sources in West Bengal (Referred to Chart 22).
State Level Summary on Culturable Command Area (CCA) during 2006-2007
|
State Name : West Bengal |
||||||||||||||||||||||||||||||||||||||
| Sl.No | District Name |
|
|
|
|
|
|
Total CCA | ||||||||||||||||||||||||||||||
| 1 | BANKURA | 1365 | 1294.00 | 17586 | 36949.54 | 168 | 4227.33 | 8971 | 110468.04 | 2633 | 21080.42 | 42470.87 | 131548.46 | 174019.33 | ||||||||||||||||||||||||
| 2 | BARDDHAMAN | 63 | 370.98 | 33923 | 128811.15 | 655 | 26067.22 | 491 | 32006.08 | 2277 | 18373.76 | 155249.35 | 50379.84 | 205629.19 | ||||||||||||||||||||||||
| 3 | BIRBHUM | 167 | 366.04 | 10979 | 46219.47 | 136 | 3939.12 | 1518 | 7765.31 | 10681 | 41254.18 | 50524.64 | 49019.49 | 99544.13 | ||||||||||||||||||||||||
| 4 | DAKSHIN DINAJPUR | 31 | 86.67 | 23911 | 72170.00 | 154 | 6072.16 | 33 | 244.07 | 1187 | 20732.95 | 78328.83 | 20977.02 | 99305.86 | ||||||||||||||||||||||||
| 5 | DARJEELING | 229 | 607.83 | 1035 | 3387.04 | 4 | 300.00 | 169 | 8263.17 | 143 | 4615.4 | 4294.87 | 12878.57 | 17173.44 | ||||||||||||||||||||||||
| 6 | HAORA | 1 | 26.00 | 570 | 2450.90 | 220 | 7629.78 | 192 | 7573.81 | 6233 | 30310.04 | 10106.68 | 37883.85 | 47990.53 | ||||||||||||||||||||||||
| 7 | HOOGHLY | 0 | 0.00 | 15530 | 65672.06 | 552 | 20069.19 | 76 | 7515.78 | 2387 | 23018.9 | 85741.25 | 30534.68 | 116275.93 | ||||||||||||||||||||||||
| 8 | JALPAIGURI | 3293 | 14164.53 | 7254 | 29413.52 | 184 | 11128.65 | 228 | 23718.88 | 740 | 28747.13 | 54706.7 | 52466.01 | 107172.71 | ||||||||||||||||||||||||
| 9 | KOCH BEHAR | 1098 | 1302.78 | 41219 | 92131.38 | 78 | 3113.40 | 9 | 77.81 | 630 | 12289.96 | 96547.56 | 12367.77 | 108915.33 | ||||||||||||||||||||||||
| 10 | MALDA | 60 | 237.84 | 25703 | 80995.05 | 377 | 14397.38 | 239 | 1807.20 | 2287 | 34648.48 | 95630.27 | 36455.68 | 132085.95 | ||||||||||||||||||||||||
| 11 | MURSHIDABAD | 2 | 4.00 | 68077 | 200054.35 | 632 | 24782.23 | 229 | 2933.11 | 1625 | 16519.95 | 224840.58 | 19453.06 | 244293.64 | ||||||||||||||||||||||||
| 12 | NADIA | 23 | 179.26 | 94347 | 157086.37 | 793 | 31027.26 | 112 | 1708.20 | 361 | 12568.91 | 188292.89 | 14277.11 | 202570 | ||||||||||||||||||||||||
| 13 | NORTH 24 PARGANAS | 33 | 229.38 | 52058 | 83449.57 | 381 | 14718.31 | 864 | 1692.75 | 790 | 5491.68 | 98397.26 | 7184.43 | 105581.69 | ||||||||||||||||||||||||
| 14 | PASHCHIM MIDNAPORE | 2411 | 4243.90 | 48077 | 174369.81 | 407 | 14884.68 | 728 | 13892.36 | 2944 | 31227.21 | 193498.39 | 45119.57 | 238617.96 | ||||||||||||||||||||||||
| 15 | PURBA MIDNAPORE | 1 | 6.00 | 10102 | 83133.07 | 187 | 6955.27 | 449 | 9908.49 | 3110 | 31639.41 | 90094.34 | 41547.9 | 131642.24 | ||||||||||||||||||||||||
| 16 | PURULIA | 3611 | 2059.44 | 15 | 15.65 | 0 | 0.00 | 13732 | 57682.47 | 539 | 6269.71 | 2075.09 | 63952.18 | 66027.27 | ||||||||||||||||||||||||
| 17 | SOUTH 24 PARGANAS | 0 | 0.00 | 6871 | 17632.76 | 71 | 1445.00 | 1804 | 37321.75 | 9946 | 60136.73 | 19077.76 | 97458.48 | 116536.24 | ||||||||||||||||||||||||
| 18 | UTTAR DINAJPUR | 79 | 289.67 | 44519 | 139257.19 | 197 | 7599.60 | 25 | 421.39 | 240 | 4627.18 | 147146.46 | 5048.57 | 152195.03 | ||||||||||||||||||||||||
| Total : | 12467 | 25468.32 | 501776 | 1413198.87 | 5196 | 198356.58 | 29869 | 325000.67 | 48753 | 403552.00 | 1637023.77 | 728552.67 | 2365576.44 | |||||||||||||||||||||||||
State Level Summary on Irrigation Potential during 2006-2007
|
State Name : West Bengal |
||||||||||||||||||||||||||||||||||
| Sl.No | District Name |
|
|
|
|
|
Irrigation Potential of Ground Water Scheme |
Irrigation Potential of Surface Water Scheme |
Total Irrigation Potential (ha) |
|||||||||||||||||||||||||
| 1 | BANKURA | 1365 | 1646.61 | 17586 | 66616.34 | 168 | 6345.55 | 8971 | 156988.09 | 2633 | 33735.36 | 74608.50 | 190723.45 | 265331.95 | ||||||||||||||||||||
| 2 | BARDDHAMAN | 63 | 530.38 | 33923 | 217256.16 | 655 | 52650.89 | 491 | 46402.52 | 2277 | 33067.27 | 270437.43 | 79469.79 | 349907.22 | ||||||||||||||||||||
| 3 | BIRBHUM | 167 | 559.68 | 10979 | 61103.00 | 136 | 6922.36 | 1518 | 9511.08 | 10681 | 66472.16 | 68585.04 | 75983.24 | 144568.28 | ||||||||||||||||||||
| 4 | DAKSHIN DINAJPUR | 31 | 97.76 | 23911 | 105872.31 | 154 | 9843.04 | 33 | 359.43 | 1187 | 33630.93 | 115813.11 | 33990.36 | 149803.47 | ||||||||||||||||||||
| 5 | DARJEELING | 229 | 942.91 | 1035 | 5587.09 | 4 | 300.00 | 169 | 9837.91 | 143 | 7384.78 | 6830.00 | 17222.69 | 24052.69 | ||||||||||||||||||||
| 6 | HAORA | 1 | 26.00 | 570 | 3958.10 | 220 | 14227.97 | 192 | 9850.07 | 6233 | 50076.85 | 18212.07 | 59926.92 | 78138.99 | ||||||||||||||||||||
| 7 | HOOGHLY | 0 | 0.00 | 15530 | 113810.79 | 552 | 34468.19 | 76 | 8937.57 | 2387 | 41427.97 | 148278.98 | 50365.54 | 198644.52 | ||||||||||||||||||||
| 8 | JALPAIGURI | 3293 | 21166.68 | 7254 | 49597.21 | 184 | 14616.80 | 228 | 26540.74 | 740 | 45989.11 | 85380.69 | 72529.85 | 157910.54 | ||||||||||||||||||||
| 9 | KOCH BEHAR | 1098 | 1631.01 | 41219 | 138911.25 | 78 | 5291.00 | 9 | 94.61 | 630 | 19680.72 | 145833.26 | 19775.33 | 165608.59 | ||||||||||||||||||||
| 10 | MALDA | 60 | 375.46 | 25703 | 119771.15 | 377 | 20121.74 | 239 | 1902.51 | 2287 | 60298.14 | 140268.35 | 62200.65 | 202469.00 | ||||||||||||||||||||
| 11 | MURSHIDABAD | 2 | 6.00 | 68077 | 289689.99 | 632 | 38325.99 | 229 | 2562.07 | 1625 | 31252.19 | 328021.98 | 33814.26 | 361836.24 | ||||||||||||||||||||
| 12 | NADIA | 23 | 253.04 | 94347 | 252670.05 | 793 | 57092.18 | 112 | 2362.40 | 361 | 23263.16 | 310015.27 | 25625.56 | 335640.83 | ||||||||||||||||||||
| 13 | NORTH 24 PARGANAS | 33 | 289.28 | 52058 | 137819.56 | 381 | 23681.68 | 864 | 2098.01 | 790 | 9882.63 | 161790.52 | 11980.64 | 173771.16 | ||||||||||||||||||||
| 14 | PASHCHIM MIDNAPORE | 2411 | 6060.41 | 48077 | 270314.54 | 407 | 15599.95 | 728 | 15313.66 | 2944 | 51152.87 | 291974.90 | 66466.53 | 358441.43 | ||||||||||||||||||||
| 15 | PURBA MIDNAPORE | 1 | 15.00 | 10102 | 95463.09 | 187 | 10632.24 | 449 | 12188.38 | 3110 | 53788.23 | 106110.33 | 65976.61 | 172086.94 | ||||||||||||||||||||
| 16 | PURULIA | 3611 | 2259.25 | 15 | 16.11 | 0 | 0.00 | 13732 | 65803.98 | 539 | 10029.44 | 2275.36 | 75833.42 | 78108.78 | ||||||||||||||||||||
| 17 | SOUTH 24 PARGANAS | 0 | 0.00 | 6871 | 24529.61 | 71 | 2846.00 | 1804 | 40725.21 | 9946 | 102193.64 | 27375.61 | 142918.85 | 170294.46 | ||||||||||||||||||||
| 18 | UTTAR DINAJPUR | 79 | 376.32 | 44519 | 215941.79 | 197 | 11611.38 | 25 | 627.51 | 240 | 7403.66 | 227929.49 | 8031.17 | 235960.66 | ||||||||||||||||||||
| Total : | 12467 | 36235.79 | 501776 | 2168928.14 | 5196 | 324576.96 | 29869 | 412105.75 | 48753 | 680729.11 | 2529740.89 | 1092834.86 | 3622575.75 | |||||||||||||||||||||
State Level Summary on Actual Irrigation during 2006-2007
|
State Name : West Bengal |
||||||||||||||||||||||||||||||||||
| Sl.No | District Name |
|
|
|
|
|
Actual Area Irrigated by Ground Water Scheme (ha.) |
Actual Area Irrigated by Surface Water Scheme (ha) |
Total Actual Area Irrigated (ha) |
|||||||||||||||||||||||||
| 1 | BANKURA | 1365 | 779.42 | 17586 | 31725.17 | 168 | 3185.95 | 897 | 1 90086.89 | 2633 | 13047.47 | 35690.54 | 103134.36 | 138824.90 | ||||||||||||||||||||
| 2 | BARDDHAMAN | 63 | 441.66 | 33923 | 142572.84 | 655 | 33884.18 | 491 | 6902.68 | 2277 | 17897.00 | 176898.68 | 24799.68 | 201698.36 | ||||||||||||||||||||
| 3 | BIRBHUM | 167 | 268.90 | 10979 | 30627.92 | 136 | 2231.96 | 1518 | 3599.51 | 10681 | 26702.90 | 33128.78 | 30302.41 | 63431.19 | ||||||||||||||||||||
| 4 | DAKSHIN DINAJPUR | 31 | 83.71 | 23911 | 63561.91 | 154 | 8483.26 | 33 | 119.98 | 1187 | 10403.62 | 72128.88 | 10523.60 | 82652.48 | ||||||||||||||||||||
| 5 | DARJEELING | 229 | 592.15 | 1035 | 3156.45 | 4 | 272.00 | 169 | 4819.12 | 143 | 3952.28 | 4020.60 | 8771.40 | 12792.00 | ||||||||||||||||||||
| 6 | HAORA | 1 | 26.00 | 570 | 3270.26 | 220 | 6766.32 | 192 | 7414.98 | 6233 | 27915.09 | 10062.58 | 35330.07 | 45392.65 | ||||||||||||||||||||
| 7 | HOOGHLY | 0 | 0.00 | 15530 | 100644.55 | 552 | 23886.04 | 76 | 6797.22 | 2387 | 27802.22 | 124530.59 | 34599.44 | 159130.03 | ||||||||||||||||||||
| 8 | JALPAIGURI | 3293 | 9177.02 | 7254 | 18030.66 | 184 | 9210.26 | 228 | 16364.47 | 740 | 17526.86 | 36417.94 | 33891.33 | 70309.27 | ||||||||||||||||||||
| 9 | KOCH BEHAR | 1098 | 1000.57 | 41219 | 73563.93 | 78 | 2653.49 | 9 | 9.05 | 630 | 4947.13 | 77217.99 | 4956.18 | 82174.17 | ||||||||||||||||||||
| 10 | MALDA | 60 | 368.80 | 25703 | 93585.34 | 377 | 12310.81 | 239 | 1779.45 | 2287 | 15410.92 | 106264.95 | 17190.37 | 123455.32 | ||||||||||||||||||||
| 11 | MURSHIDABAD | 2 | 6.00 | 68077 | 150935.72 | 632 | 17056.48 | 229 | 1520.45 | 1625 | 10576.66 | 167998.20 | 12097.11 | 180095.31 | ||||||||||||||||||||
| 12 | NADIA | 23 | 189.09 | 94347 | 233516.68 | 793 | 29646.24 | 112 | 1889.87 | 361 | 11333.66 | 263352.01 | 13223.53 | 276575.54 | ||||||||||||||||||||
| 13 | NORTH 24 PARGANAS | 33 | 272.14 | 52058 | 114270.38 | 381 | 10733.62 | 864 | 1623.31 | 790 | 4057.89 | 125276.14 | 5681.20 | 130957.34 | ||||||||||||||||||||
| 14 | PASHCHIM MIDNAPORE | 2411 | 4420.61 | 48077 | 211989.67 | 407 | 8762.95 | 728 | 8143.85 | 2944 | 24520.70 | 225173.23 | 32664.55 | 257837.78 | ||||||||||||||||||||
| 15 | PURBA MIDNAPORE | 1 | 2.00 | 10102 | 63441.49 | 187 | 4609.49 | 449 | 10437.07 | 3110 | 26643.51 | 68052.98 | 37080.58 | 105133.56 | ||||||||||||||||||||
| 16 | PURULIA | 3611 | 1283.22 | 15 | 4.53 | 0 | 0.00 | 13732 | 42083.26 | 539 | 2638.22 | 1287.75 | 44721.48 | 46009.23 | ||||||||||||||||||||
| 17 | SOUTH 24 PARGANAS | 0 | 0.00 | 6871 | 15045.03 | 71 | 1239.35 | 1804 | 34606.63 | 9946 | 45215.54 | 16284.38 | 79822.17 | 96106.55 | ||||||||||||||||||||
| 18 | UTTAR DINAJPUR | 79 | 306.90 | 44519 | 161148.31 | 197 | 4828.97 | 25 | 251.87 | 240 | 3090.02 | 166284.18 | 3341.89 | 169626.07 | ||||||||||||||||||||
| Total : | 12467 | 19218.19 | 501776 | 1511090.84 | 5196 | 179761.37 | 29869 | 238449.66 | 48753 | 293681.69 | 1710070.40 | 532131.35 | 2242201.75 | |||||||||||||||||||||
District Level Abstract of Dug Wells
|
State Name : West Bengal |
|||||||||||||||||||||||||||||||||||||||||||||||
| Sl.No | District Name |
No. of Dug Wells
|
|
|
|
|
|||||||||||||||||||||||||||||||||||||||||
| 1 | BANKURA | 74 | 88 | 1203 | 89 | 1276 | 1294.00 | 897.98 | 709.29 | 12.82 | 26.52 | 1646.61 | 389.60 | 375.01 | 2.62 | 12.19 | 779.42 | ||||||||||||||||||||||||||||||
| 2 | BARDDHAMAN | 1 | 0 | 62 | 1 | 62 | 370.98 | 281.28 | 27.15 | 0.50 | 221.45 | 530.38 | 252.76 | 18.80 | 5.50 | 164.60 | 441.66 | ||||||||||||||||||||||||||||||
| 3 | BIRBHUM | 36 | 22 | 109 | 51 | 116 | 366.04 | 244.37 | 201.66 | 4.16 | 109.49 | 559.68 | 49.93 | 139.18 | 1.96 | 77.83 | 268.90 | ||||||||||||||||||||||||||||||
| 4 | DAKSHIN DINAJPUR | 0 | 0 | 31 | 0 | 31 | 86.67 | 19.77 | 45.76 | 0.00 | 32.23 | 97.76 | 13.11 | 41.43 | 0.00 | 29.17 | 83.71 | ||||||||||||||||||||||||||||||
| 5 | DARJEELING | 10 | 27 | 192 | 104 | 125 | 607.83 | 513.52 | 419.49 | 5.20 | 4.70 | 942.91 | 356.66 | 230.24 | 4.05 | 1.20 | 592.15 | ||||||||||||||||||||||||||||||
| 6 | HAORA | 0 | 0 | 1 | 0 | 1 | 26.00 | 0.00 | 0.00 | 0.00 | 26.00 | 26.00 | 0.00 | 0.00 | 0.00 | 26.00 | 26.00 | ||||||||||||||||||||||||||||||
| 7 | JALPAIGURI | 155 | 159 | 2979 | 1000 | 2293 | 14164.53 | 11024.08 | 7643.09 | 653.01 | 1846.50 | 21166.68 | 3212.33 | 4390.99 | 304.07 | 1269.63 | 9177.02 | ||||||||||||||||||||||||||||||
| 8 | KOCH BEHAR | 6 | 180 | 912 | 22 | 1076 | 1302.78 | 567.63 | 771.18 | 16.57 | 275.63 | 1631.01 | 290.40 | 551.67 | 3.61 | 154.86 | 1000.57 | ||||||||||||||||||||||||||||||
| 9 | MALDA | 0 | 0 | 60 | 10 | 50 | 237.84 | 149.32 | 119.15 | 2.20 | 104.79 | 375.46 | 146.24 | 124.15 | 1.20 | 97.21 | 368.80 | ||||||||||||||||||||||||||||||
| 10 | MURSHIDABAD | 0 | 0 | 2 | 0 | 2 | 4.00 | 2.00 | 2.00 | 0.00 | 2.00 | 6.00 | 2.00 | 2.00 | 0.00 | 2.00 | 6.00 | ||||||||||||||||||||||||||||||
| 11 | NADIA | 0 | 1 | 22 | 8 | 15 | 179.26 | 115.74 | 111.60 | 3.58 | 22.12 | 253.04 | 79.78 | 70.55 | 3.50 | 35.26 | 189.09 | ||||||||||||||||||||||||||||||
| 12 | NORTH 24 PARGANAS | 1 | 1 | 31 | 6 | 27 | 229.38 | 77.93 | 82.97 | 3.39 | 124.99 | 289.28 | 74.84 | 78.11 | 1.39 | 117.80 | 272.14 | ||||||||||||||||||||||||||||||
| 13 | PASHCHIM MIDNAPORE | 26 | 19 | 2366 | 25 | 2386 | 4243.90 | 2092.82 | 3510.73 | 41.93 | 414.93 | 6060.41 | 1606.18 | 2459.68 | 25.14 | 329.61 | 4420.61 | ||||||||||||||||||||||||||||||
| 14 | PURBA MIDNAPORE | 0 | 0 | 1 | 0 | 1 | 6.00 | 6.00 | 5.00 | 2.00 | 2.00 | 15.00 | 0.00 | 2.00 | 0.00 | 0.00 | 2.00 | ||||||||||||||||||||||||||||||
| 15 | PURULIA | 90 | 118 | 3403 | 518 | 3093 | 2059.44 | 774.52 | 1219.05 | 99.95 | 165.73 | 2259.25 | 254.17 | 880.04 | 55.19 | 93.82 | 1283.22 | ||||||||||||||||||||||||||||||
| 16 | UTTAR DINAJPUR | 0 | 5 | 74 | 4 | 75 | 289.67 | 121.82 | 86.88 | 27.00 | 140.62 | 376.32 | 80.44 | 67.73 | 25.50 | 133.23 | 306.90 | ||||||||||||||||||||||||||||||
| Total : | 399 | 620 | 11448 | 1838 | 10629 | 25468.32 | 16888.78 | 14955.00 | 872.31 | 3519.70 | 36235.79 | 6808.44 | 9431.58 | 433.73 | 2544.41 | 19218.19 | |||||||||||||||||||||||||||||||
District Level Abstract of Shallow Tubewells
|
State Name : West Bengal |
|||||||||||||||||||||||||||||||||||||||||||||||
| Sl.No | District Name |
No. of Shallow Tubewells
|
|
|
|
|
|||||||||||||||||||||||||||||||||||||||||
| 1 | BANKURA | 182 | 225 | 17179 | 222 | 17364 | 36949.54 | 27113.76 | 26728.66 | 213.93 | 12559.99 | 66616.34 | 13440.71 | 13955.90 | 152.90 | 4175.66 | 31725.17 | ||||||||||||||||||||||||||||||
| 2 | BARDDHAMAN | 214 | 1035 | 32674 | 576 | 33347 | 128811.15 | 94460.12 | 43270.36 | 423.02 | 79102.66 | 217256.16 | 63445.97 | 27911.63 | 213.58 | 51001.66 | 142572.84 | ||||||||||||||||||||||||||||||
| 3 | BIRBHUM | 181 | 405 | 10393 | 79 | 10900 | 46219.47 | 16769.70 | 18199.56 | 706.60 | 25427.14 | 61103.00 | 5198.49 | 9729.77 | 297.11 | 15402.55 | 30627.92 | ||||||||||||||||||||||||||||||
| 4 | DAKSHIN DINAJPUR | 215 | 180 | 23516 | 539 | 23372 | 72170.00 | 44367.42 | 18167.86 | 231.05 | 43105.98 | 105872.31 | 19714.15 | 10273.45 | 99.79 | 33474.54 | 63561.91 | ||||||||||||||||||||||||||||||
| 5 | DARJEELING | 14 | 162 | 859 | 666 | 369 | 3387.04 | 2749.66 | 2531.61 | 248.67 | 57.15 | 5587.09 | 1742.42 | 1203.69 | 196.84 | 13.50 | 3156.45 | ||||||||||||||||||||||||||||||
| 6 | HAORA | 6 | 8 | 556 | 40 | 530 | 2450.90 | 1461.69 | 1957.62 | 57.37 | 481.42 | 3958.10 | 1119.89 | 1818.53 | 7.07 | 324.77 | 3270.26 | ||||||||||||||||||||||||||||||
| 7 | HOOGHLY | 221 | 183 | 15126 | 222 | 15308 | 65672.06 | 45397.22 | 36555.04 | 539.67 | 31318.86 | 113810.79 | 37837.02 | 33118.13 | 437.97 | 29251.43 | 100644.55 | ||||||||||||||||||||||||||||||
| 8 | JALPAIGURI | 587 | 620 | 6047 | 2178 | 5076 | 29413.52 | 26804.06 | 17976.18 | 1478.19 | 3338.78 | 49597.21 | 6533.09 | 8990.14 | 804.36 | 1703.07 | 18030.66 | ||||||||||||||||||||||||||||||
| 9 | KOCH BEHAR | 330 | 375 | 40514 | 1732 | 39487 | 92131.38 | 62082.45 | 53584.85 | 1481.18 | 21762.77 | 138911.25 | 20491.78 | 38423.79 | 551.29 | 14097.07 | 73563.93 | ||||||||||||||||||||||||||||||
| 10 | MALDA | 76 | 67 | 25560 | 336 | 25367 | 80995.05 | 55928.94 | 35243.16 | 2064.76 | 26534.29 | 119771.15 | 35298.44 | 31398.78 | 1831.26 | 25056.86 | 93585.34 | ||||||||||||||||||||||||||||||
| 11 | MURSHIDABAD | 536 | 825 | 66716 | 453 | 67624 | 200054.35 | 148051.23 | 100959.30 | 2016.01 | 38663.45 | 289689.99 | 63077.00 | 71513.07 | 1085.88 | 15259.77 | 150935.72 | ||||||||||||||||||||||||||||||
| 12 | NADIA | 247 | 235 | 93865 | 865 | 93482 | 157086.37 | 120340.01 | 91704.41 | 4155.80 | 36469.83 | 252670.05 | 111286.52 | 84771.19 | 3410.78 | 34048.19 | 233516.68 | ||||||||||||||||||||||||||||||
| 13 | NORTH 24 PARGANAS | 242 | 349 | 51467 | 280 | 51778 | 83449.57 | 62527.01 | 35800.89 | 3555.10 | 35936.56 | 137819.56 | 44448.90 | 32194.93 | 2527.06 | 35099.49 | 114270.38 | ||||||||||||||||||||||||||||||
| 14 | PASHCHIM MIDNAPORE | 569 | 1154 | 46354 | 599 | 47478 | 174369.81 | 111385.79 | 76051.21 | 2179.01 | 80698.53 | 270314.54 | 79869.93 | 61616.60 | 1550.63 | 68952.51 | 211989.67 | ||||||||||||||||||||||||||||||
| 15 | PURBA MIDNAPORE | 103 | 95 | 9904 | 181 | 9921 | 83133.07 | 31857.39 | 6696.65 | 240.35 | 56668.70 | 95463.09 | 7452.96 | 6371.15 | 82.93 | 49534.45 | 63441.49 | ||||||||||||||||||||||||||||||
| 16 | PURULIA | 0 | 2 | 13 | 3 | 12 | 15.65 | 8.86 | 6.11 | 0.13 | 1.01 | 16.11 | 1.20 | 3.13 | 0.00 | 0.20 | 4.53 | ||||||||||||||||||||||||||||||
| 17 | SOUTH 24 PARGANAS | 6 | 24 | 6841 | 40 | 6831 | 17632.76 | 6683.65 | 11691.29 | 1175.09 | 4979.58 | 24529.61 | 2641.16 | 9237.51 | 453.56 | 2712.80 | 15045.03 | ||||||||||||||||||||||||||||||
| 18 | UTTAR DINAJPUR | 302 | 82 | 44135 | 407 | 44112 | 139257.19 | 92292.82 | 53591.15 | 6674.93 | 63382.89 | 215941.79 | 57014.33 | 43908.67 | 4494.15 | 55731.16 | 161148.31 | ||||||||||||||||||||||||||||||
| Total : | 4031 | 6026 | 491719 | 9418 | 492358 | 1413198.87 | 950281.78 | 630715.91 | 27440.86 | 560489.59 | 2168928.14 | 570613.96 | 486440.06 | 18197.16 | 435839.68 | 1511090.84 | |||||||||||||||||||||||||||||||
District Level Abstract of Deep Tubewell
|
State Name : West Bengal |
|||||||||||||||||||||||||||||||||||||||||||||||
| Sl.No | District Name |
No. of Deep TubeWells
|
|
|
|
|
|||||||||||||||||||||||||||||||||||||||||
| 1 | BANKURA | 4 | 8 | 156 | 156 | 12 | 4227.33 | 3391.89 | 2264.87 | 29.02 | 659.77 | 6345.55 | 1840.62 | 1048.04 | 3.40 | 293.89 | 3185.95 | ||||||||||||||||||||||||||||||
| 2 | BARDDHAMAN | 9 | 11 | 635 | 630 | 25 | 26067.22 | 24678.62 | 16710.06 | 344.96 | 10917.25 | 52650.89 | 16719.01 | 9200.18 | 332.34 | 7632.65 | 33884.18 | ||||||||||||||||||||||||||||||
| 3 | BIRBHUM | 3 | 19 | 114 | 131 | 5 | 3939.12 | 3931.64 | 2060.17 | 68.44 | 862.12 | 6922.36 | 1072.64 | 603.25 | 10.01 | 546.06 | 2231.96 | ||||||||||||||||||||||||||||||
| 4 | DAKSHIN DINAJPUR | 1 | 1 | 152 | 152 | 2 | 6072.16 | 4077.35 | 2792.79 | 52.00 | 2920.90 | 9843.04 | 3415.76 | 2233.95 | 156.00 | 2677.56 | 8483.26 | ||||||||||||||||||||||||||||||
| 5 | DARJEELING | 0 | 0 | 4 | 1 | 3 | 300.00 | 0.00 | 0.00 | 300.00 | 0.00 | 300.00 | 0.00 | 0.00 | 272.00 | 0.00 | 272.00 | ||||||||||||||||||||||||||||||
| 6 | HAORA | 11 | 10 | 199 | 201 | 19 | 7629.78 | 6553.44 | 3801.71 | 195.23 | 3677.59 | 14227.97 | 2576.79 | 2961.62 | 157.00 | 1070.91 | 6766.32 | ||||||||||||||||||||||||||||||
| 7 | HOOGHLY | 14 | 16 | 522 | 552 | 0 | 20069.19 | 16436.31 | 10445.95 | 151.36 | 7434.57 | 34468.19 | 10564.35 | 8284.83 | 21.55 | 5015.31 | 23886.04 | ||||||||||||||||||||||||||||||
| 8 | JALPAIGURI | 4 | 20 | 160 | 65 | 119 | 11128.65 | 2957.79 | 2208.34 | 4615.41 | 4835.26 | 14616.80 | 389.40 | 1063.78 | 3318.00 | 4439.08 | 9210.26 | ||||||||||||||||||||||||||||||
| 9 | KOCH BEHAR | 2 | 2 | 74 | 77 | 1 | 3113.40 | 2322.00 | 1688.00 | 83.00 | 1198.00 | 5291.00 | 1215.64 | 796.93 | 19.00 | 621.92 | 2653.49 | ||||||||||||||||||||||||||||||
| 10 | MALDA | 9 | 12 | 356 | 367 | 10 | 14397.38 | 9574.44 | 5567.22 | 313.14 | 4666.94 | 20121.74 | 5959.38 | 4217.62 | 430.81 | 1703.00 | 12310.81 | ||||||||||||||||||||||||||||||
| 11 | MURSHIDABAD | 29 | 62 | 541 | 616 | 16 | 24782.23 | 16405.78 | 11335.84 | 516.00 | 10068.37 | 38325.99 | 7670.99 | 6147.95 | 291.50 | 2946.04 | 17056.48 | ||||||||||||||||||||||||||||||
| 12 | NADIA | 17 | 42 | 734 | 762 | 31 | 31027.26 | 28710.45 | 18229.90 | 794.37 | 9357.46 | 57092.18 | 14008.76 | 10890.34 | 346.47 | 4400.67 | 29646.24 | ||||||||||||||||||||||||||||||
| 13 | NORTH 24 PARGANAS | 6 | 18 | 357 | 361 | 20 | 14718.31 | 11164.52 | 8036.39 | 235.56 | 4245.21 | 23681.68 | 4610.83 | 2895.01 | 176.19 | 3051.59 | 10733.62 | ||||||||||||||||||||||||||||||
| 14 | PASHCHIM MIDNAPORE | 2 | 20 | 385 | 346 | 61 | 14884.68 | 10342.49 | 2022.09 | 97.33 | 3138.04 | 15599.95 | 4306.37 | 2313.83 | 27.32 | 2115.43 | 8762.95 | ||||||||||||||||||||||||||||||
| 15 | PURBA MIDNAPORE | 23 | 4 | 160 | 182 | 5 | 6955.27 | 6012.98 | 1623.05 | 56.10 | 2940.11 | 10632.24 | 1215.59 | 530.18 | 11.10 | 2852.62 | 4609.49 | ||||||||||||||||||||||||||||||
| 16 | SOUTH 24 PARGANAS | 6 | 16 | 49 | 68 | 3 | 1445.00 | 1396.00 | 1023.00 | 237.00 | 190.00 | 2846.00 | 631.82 | 500.03 | 12.50 | 95.00 | 1239.35 | ||||||||||||||||||||||||||||||
| 17 | UTTAR DINAJPUR | 12 | 12 | 173 | 191 | 6 | 7599.60 | 7043.10 | 2469.48 | 107.00 | 1991.80 | 11611.38 | 2716.03 | 1065.93 | 3.54 | 1043.47 | 4828.97 | ||||||||||||||||||||||||||||||
| Total : | 152 | 273 | 4771 | 4858 | 338 | 198356.58 | 154998.79 | 92278.86 | 8195.92 | 69103.39 | 324576.96 | 78913.98 | 54753.47 | 5588.73 | 40505.20 | 179761.37 | |||||||||||||||||||||||||||||||
District Level Abstract of Surface Flow Irrigation
|
State Name : West Bengal |
|||||||||||||||||||||||||||||||||||||||||||||||
| Sl.No | District Name |
No. of Surface Flow Irrigation
|
|
|
|
|
|||||||||||||||||||||||||||||||||||||||||
| 1 | BANKURA | 271 | 174 | 8526 | 683 | 8288 | 110468.04 | 106093.01 | 45233.73 | 213.38 | 5447.97 | 156988.09 | 72407.97 | 16406.85 | 54.30 | 1217.77 | 90086.89 | ||||||||||||||||||||||||||||||
| 2 | BARDDHAMAN | 58 | 14 | 419 | 268 | 223 | 32006.08 | 31199.63 | 8760.91 | 31.00 | 6410.98 | 46402.52 | 5069.43 | 1464.08 | 10.50 | 358.67 | 6902.68 | ||||||||||||||||||||||||||||||
| 3 | BIRBHUM | 16 | 119 | 1383 | 70 | 1448 | 7765.31 | 5044.17 | 3410.20 | 107.02 | 949.69 | 9511.08 | 1753.95 | 1674.41 | 51.08 | 120.07 | 3599.51 | ||||||||||||||||||||||||||||||
| 4 | DAKSHIN DINAJPUR | 2 | 13 | 18 | 3 | 30 | 244.07 | 155.18 | 53.68 | 1.00 | 149.57 | 359.43 | 32.70 | 38.19 | 1.00 | 48.09 | 119.98 | ||||||||||||||||||||||||||||||
| 5 | DARJEELING | 32 | 39 | 98 | 131 | 38 | 8263.17 | 3392.75 | 1966.94 | 4459.22 | 19.00 | 9837.91 | 1704.45 | 833.75 | 2107.92 | 173.00 | 4819.12 | ||||||||||||||||||||||||||||||
| 6 | HAORA | 1 | 12 | 179 | 109 | 83 | 7573.81 | 5116.84 | 2527.03 | 172.54 | 2033.66 | 9850.07 | 3647.15 | 2009.32 | 92.23 | 1666.28 | 7414.98 | ||||||||||||||||||||||||||||||
| 7 | HOOGHLY | 0 | 1 | 75 | 44 | 32 | 7515.78 | 2597.60 | 1313.83 | 0.00 | 5026.14 | 8937.57 | 2356.91 | 1108.65 | 0.00 | 3331.66 | 6797.22 | ||||||||||||||||||||||||||||||
| 8 | JALPAIGURI | 15 | 10 | 203 | 112 | 116 | 23718.88 | 13987.90 | 4171.85 | 704.00 | 7676.99 | 26540.74 | 7395.25 | 2211.48 | 677.92 | 6079.82 | 16364.47 | ||||||||||||||||||||||||||||||
| 9 | KOCH BEHAR | 1 | 1 | 7 | 3 | 6 | 77.81 | 45.69 | 30.97 | 12.00 | 5.95 | 94.61 | 4.13 | 3.99 | 0.00 | 0.93 | 9.05 | ||||||||||||||||||||||||||||||
| 10 | MALDA | 6 | 2 | 231 | 17 | 222 | 1807.20 | 417.30 | 1204.75 | 13.40 | 267.06 | 1902.51 | 368.03 | 1165.56 | 11.66 | 234.20 | 1779.45 | ||||||||||||||||||||||||||||||
| 11 | MURSHIDABAD | 1 | 30 | 198 | 53 | 176 | 2933.11 | 1344.93 | 965.14 | 36.00 | 216.00 | 2562.07 | 631.85 | 780.60 | 13.00 | 95.00 | 1520.45 | ||||||||||||||||||||||||||||||
| 12 | NADIA | 1 | 0 | 111 | 67 | 45 | 1708.20 | 1112.01 | 927.72 | 35.00 | 287.67 | 2362.40 | 885.67 | 721.45 | 35.00 | 247.75 | 1889.87 | ||||||||||||||||||||||||||||||
| 13 | NORTH 24 PARGANAS | 3 | 92 | 769 | 186 | 678 | 1692.75 | 959.23 | 706.36 | 41.61 | 390.81 | 2098.01 | 610.60 | 613.54 | 40.72 | 358.45 | 1623.31 | ||||||||||||||||||||||||||||||
| 14 | PASHCHIM MIDNAPORE | 7 | 57 | 664 | 310 | 418 | 13892.36 | 8316.62 | 4747.74 | 73.55 | 2175.75 | 15313.66 | 3594.01 | 2835.04 | 27.70 | 1687.10 | 8143.85 | ||||||||||||||||||||||||||||||
| 15 | PURBA MIDNAPORE | 0 | 7 | 442 | 76 | 373 | 9908.49 | 3247.13 | 22.33 | 150.88 | 8768.04 | 12188.38 | 1710.52 | 19.31 | 114.49 | 8592.75 | 10437.07 | ||||||||||||||||||||||||||||||
| 16 | PURULIA | 223 | 594 | 12915 | 658 | 13074 | 57682.47 | 46074.94 | 16376.11 | 976.44 | 2376.49 | 65803.98 | 30907.24 | 9645.67 | 287.04 | 1243.31 | 42083.26 | ||||||||||||||||||||||||||||||
| 17 | SOUTH 24 PARGANAS | 7 | 45 | 1752 | 130 | 1674 | 37321.75 | 10900.24 | 11179.99 | 3355.26 | 15289.72 | 40725.21 | 8578.82 | 10275.73 | 2700.82 | 13051.26 | 34606.63 | ||||||||||||||||||||||||||||||
| 18 | UTTAR DINAJPUR | 2 | 2 | 21 | 12 | 13 | 421.39 | 273.38 | 180.63 | 7.00 | 166.50 | 627.51 | 78.28 | 100.31 | 1.00 | 72.28 | 251.87 | ||||||||||||||||||||||||||||||
| Total : | 646 | 1212 | 28011 | 2932 | 26937 | 325000.67 | 240278.55 | 103779.91 | 10389.30 | 57657.99 | 412105.75 | 141736.96 | 51907.93 | 6226.38 | 38578.39 | 238449.66 | |||||||||||||||||||||||||||||||
District Level Abstract of Surface Lift Irrigation
|
State Name : West Bengal |
|||||||||||||||||||||||||||||||||||||||||||||||
| Sl.No | District Name |
No. of Surface Lift Irrigation
|
|
|
|
|
|||||||||||||||||||||||||||||||||||||||||
| 1 | BANKURA | 79 | 49 | 2505 | 265 | 2368 | 21080.42 | 20622.59 | 10070.79 | 945.80 | 2096.18 | 33735.36 | 8889.11 | 3423.54 | 18.72 | 716.10 | 13047.47 | ||||||||||||||||||||||||||||||
| 2 | BARDDHAMAN | 11 | 17 | 2249 | 273 | 2004 | 18373.76 | 14959.98 | 8306.84 | 2791.90 | 7008.55 | 33067.27 | 7248.63 | 5023.41 | 45.64 | 5579.32 | 17897.00 | ||||||||||||||||||||||||||||||
| 3 | BIRBHUM | 96 | 1473 | 9112 | 361 | 10320 | 41254.18 | 27573.78 | 27657.88 | 8545.71 | 2694.79 | 66472.16 | 10797.27 | 11981.45 | 2706.84 | 1217.34 | 26702.90 | ||||||||||||||||||||||||||||||
| 4 | DAKSHIN DINAJPUR | 5 | 17 | 1165 | 282 | 905 | 20732.95 | 13696.81 | 10023.94 | 3983.94 | 5926.24 | 33630.93 | 3886.62 | 3754.05 | 82.04 | 2680.91 | 10403.62 | ||||||||||||||||||||||||||||||
| 5 | DARJEELING | 13 | 24 | 106 | 112 | 31 | 4615.40 | 4001.08 | 2047.55 | 1094.60 | 241.55 | 7384.78 | 1929.55 | 972.45 | 1021.28 | 29.00 | 3952.28 | ||||||||||||||||||||||||||||||
| 6 | HAORA | 34 | 68 | 6131 | 124 | 6109 | 30310.04 | 17243.27 | 16132.47 | 6297.09 | 10404.02 | 50076.85 | 6469.63 | 11669.49 | 349.18 | 9426.79 | 27915.09 | ||||||||||||||||||||||||||||||
| 7 | HOOGHLY | 18 | 17 | 2352 | 376 | 2011 | 23018.90 | 20118.87 | 15312.60 | 429.04 | 5567.46 | 41427.97 | 11179.68 | 11919.95 | 55.03 | 4647.56 | 27802.22 | ||||||||||||||||||||||||||||||
| 8 | JALPAIGURI | 84 | 102 | 554 | 327 | 413 | 28747.13 | 26924.84 | 10202.46 | 6655.57 | 2206.24 | 45989.11 | 1666.69 | 3196.43 | 11664.31 | 999.43 | 17526.86 | ||||||||||||||||||||||||||||||
| 9 | KOCH BEHAR | 34 | 40 | 556 | 250 | 380 | 12289.96 | 8886.40 | 5627.55 | 2850.50 | 2316.27 | 19680.72 | 1518.05 | 1907.53 | 382.39 | 1139.16 | 4947.13 | ||||||||||||||||||||||||||||||
| 10 | MALDA | 102 | 27 | 2158 | 409 | 1878 | 34648.48 | 26695.18 | 20562.11 | 9228.88 | 3811.97 | 60298.14 | 4444.23 | 7543.04 | 119.57 | 3304.08 | 15410.92 | ||||||||||||||||||||||||||||||
| 11 | MURSHIDABAD | 15 | 258 | 1352 | 302 | 1323 | 16519.95 | 18371.31 | 8229.25 | 2240.97 | 2410.66 | 31252.19 | 4040.53 | 4648.74 | 106.59 | 1780.80 | 10576.66 | ||||||||||||||||||||||||||||||
| 12 | NADIA | 5 | 24 | 332 | 261 | 100 | 12568.91 | 13353.81 | 6121.83 | 1129.56 | 2657.96 | 23263.16 | 4874.27 | 4200.49 | 187.32 | 2071.58 | 11333.66 | ||||||||||||||||||||||||||||||
| 13 | NORTH 24 PARGANAS | 9 | 38 | 743 | 132 | 658 | 5491.68 | 4925.67 | 2359.76 | 907.25 | 1689.95 | 9882.63 | 1452.56 | 1027.59 | 20.33 | 1557.41 | 4057.89 | ||||||||||||||||||||||||||||||
| 14 | PASHCHIM MIDNAPORE | 22 | 75 | 2847 | 527 | 2417 | 31227.21 | 20696.44 | 17910.23 | 5787.43 | 6758.77 | 51152.87 | 7727.07 | 11020.51 | 134.13 | 5638.99 | 24520.70 | ||||||||||||||||||||||||||||||
| 15 | PURBA MIDNAPORE | 10 | 5 | 3095 | 166 | 2944 | 31639.41 | 15088.13 | 4486.97 | 9037.44 | 25175.69 | 53788.23 | 498.24 | 2276.66 | 50.58 | 23818.03 | 26643.51 | ||||||||||||||||||||||||||||||
| 16 | PURULIA | 5 | 71 | 463 | 130 | 409 | 6269.71 | 5995.62 | 2870.13 | 917.96 | 245.73 | 10029.44 | 1495.57 | 1015.72 | 35.95 | 90.98 | 2638.22 | ||||||||||||||||||||||||||||||
| 17 | SOUTH 24 PARGANAS | 8 | 13 | 9925 | 427 | 9519 | 60136.73 | 47427.17 | 23223.74 | 6034.37 | 25508.36 | 102193.64 | 15433.80 | 12520.04 | 1694.35 | 15567.35 | 45215.54 | ||||||||||||||||||||||||||||||
| 18 | UTTAR DINAJPUR | 16 | 5 | 219 | 129 | 111 | 4627.18 | 3122.55 | 1739.81 | 778.00 | 1763.30 | 7403.66 | 796.31 | 895.71 | 51.00 | 1347.00 | 3090.02 | ||||||||||||||||||||||||||||||
| Total : | 566 | 2323 | 45864 | 4853 | 43900 | 403552.00 | 309703.50 | 192885.91 | 69656.01 | 108483.69 | 680729.11 | 94347.81 | 98996.80 | 18725.25 | 81611.83 | 293681.69 | |||||||||||||||||||||||||||||||
Scheme wise Area Irrigated as Supplementary Source by Minor Irrigation Schemes
|
State Name : West Bengal |
||||||||||||||||||||||||||||||||||||||||||||||
| Sl.No | District Name |
|
|
|
||||||||||||||||||||||||||||||||||||||||||
| 1 | BANKURA | 5309.55 | 10030.05 | 45.39 | 5620.06 | 21005.03 | 16021.00 | 7414.13 | 64.80 | 2528.96 | 26028.89 | 21330.55 | 17444.18 | 110.19 | 8149.02 | 47033.92 | ||||||||||||||||||||||||||||||
| 2 | BARDDHAMAN | 6039.68 | 4484.80 | 15.64 | 17760.52 | 28300.66 | 17381.98 | 4377.55 | 0.00 | 2484.84 | 24244.37 | 23421.66 | 8862.35 | 15.64 | 20245.36 | 52545.03 | ||||||||||||||||||||||||||||||
| 3 | BIRBHUM | 1825.06 | 4752.63 | 57.96 | 6800.85 | 13436.49 | 1792.21 | 6887.54 | 110.46 | 421.70 | 9211.91 | 3617.27 | 11640.17 | 168.42 | 7222.55 | 22648.40 | ||||||||||||||||||||||||||||||
| 4 | DAKSHIN DINAJPUR | 0.00 | 0.00 | 0.00 | 0.00 | 0.00 | 0.00 | 0.00 | 0.00 | 0.00 | 0.00 | 0.00 | 0.00 | 0.00 | 0.00 | 0.00 | ||||||||||||||||||||||||||||||
| 5 | DARJEELING | 4.00 | 1.50 | 0.00 | 0.00 | 5.50 | 36.24 | 35.00 | 0.00 | 0.00 | 71.24 | 40.24 | 36.50 | 0.00 | 0.00 | 76.74 | ||||||||||||||||||||||||||||||
| 6 | HAORA | 0.00 | 0.00 | 0.00 | 0.00 | 0.00 | 1520.10 | 1972.29 | 3.00 | 55.00 | 3550.39 | 1520.10 | 1972.29 | 3.00 | 55.00 | 3550.39 | ||||||||||||||||||||||||||||||
| 7 | HOOGHLY | 401.57 | 469.89 | 1.18 | 111.83 | 984.47 | 345.09 | 607.84 | 2.36 | 9.80 | 965.09 | 746.66 | 1077.73 | 3.54 | 121.63 | 1949.56 | ||||||||||||||||||||||||||||||
| 8 | JALPAIGURI | 7.50 | 8.00 | 0.00 | 2.50 | 18.00 | 4399.75 | 9.00 | 0.00 | 1.00 | 4409.75 | 4407.25 | 17.00 | 0.00 | 3.50 | 4427.75 | ||||||||||||||||||||||||||||||
| 9 | KOCH BEHAR | 5.00 | 5.00 | 0.00 | 5.00 | 15.00 | 0.00 | 0.00 | 0.00 | 0.00 | 0.00 | 5.00 | 5.00 | 0.00 | 5.00 | 15.00 | ||||||||||||||||||||||||||||||
| 10 | MALDA | 23.80 | 9.70 | 0.00 | 8.60 | 42.10 | 45.12 | 69.32 | 0.00 | 187.32 | 301.76 | 68.92 | 79.02 | 0.00 | 195.92 | 343.86 | ||||||||||||||||||||||||||||||
| 11 | MURSHIDABAD | 493.00 | 1258.00 | 195.00 | 718.80 | 2664.80 | 218.00 | 232.12 | 28.00 | 21.00 | 499.12 | 711.00 | 1490.12 | 223.00 | 739.80 | 3163.92 | ||||||||||||||||||||||||||||||
| 12 | NADIA | 50.00 | 50.00 | 0.00 | 1.40 | 101.40 | 0.00 | 0.00 | 0.00 | 0.00 | 0.00 | 50.00 | 50.00 | 0.00 | 1.40 | 101.40 | ||||||||||||||||||||||||||||||
| 13 | NORTH 24 PARGANAS | 14.76 | 1.35 | 1.25 | 10.75 | 28.11 | 0.00 | 0.00 | 0.00 | 0.00 | 0.00 | 14.76 | 1.35 | 1.25 | 10.75 | 28.11 | ||||||||||||||||||||||||||||||
| 14 | PASHCHIM MIDNAPORE | 2523.06 | 2006.61 | 75.86 | 1704.80 | 6310.33 | 3501.48 | 1678.78 | 54.93 | 271.33 | 5506.52 | 6024.54 | 3685.39 | 130.79 | 1976.13 | 11816.85 | ||||||||||||||||||||||||||||||
| 15 | PURBA MIDNAPORE | 8.00 | 0.00 | 0.00 | 271.55 | 279.55 | 0.16 | 0.10 | 0.07 | 8.05 | 8.38 | 8.16 | 0.10 | 0.07 | 279.60 | 287.93 | ||||||||||||||||||||||||||||||
| 16 | PURULIA | 7.73 | 15.47 | 0.00 | 20.90 | 44.10 | 583.78 | 183.61 | 24.98 | 32.21 | 824.58 | 591.51 | 199.08 | 24.98 | 53.11 | 868.68 | ||||||||||||||||||||||||||||||
| 17 | SOUTH 24 PARGANAS | 501.00 | 356.95 | 134.50 | 585.00 | 1577.45 | 2025.65 | 1377.34 | 578.26 | 3504.06 | 7485.31 | 2526.65 | 1734.29 | 712.76 | 4089.06 | 9062.76 | ||||||||||||||||||||||||||||||
| 18 | UTTAR DINAJPUR | 100.44 | 286.45 | 0.00 | 304.40 | 691.29 | 4.75 | 21.25 | 0.00 | 2.25 | 28.25 | 105.19 | 307.70 | 0.00 | 306.65 | 719.54 | ||||||||||||||||||||||||||||||
| Total : | 17314.15 | 23736.40 | 526.78 | 33926.96 | 75504.28 | 47875.31 | 24865.87 | 866.86 | 9527.52 | 83135.56 | 65189.46 | 48602.27 | 1393.64 | 43454.48 | 158639.84 | |||||||||||||||||||||||||||||||
DISTRIBUTION OF DUGWELLS ACCORDING TO SOURCE OF ENERGY
|
State Name : WEST BENGAL |
||||||||
| Sl.No | Name of District | Electric Pump | Diesel Pump | Wind Mills | Solar Pumps | Manual/ Animal | Others | Total |
| 1 | BANKURA | 9 | 652 | 0 | 0 | 488 | 216 | 1365 |
| 2 | BARDDHAMAN | 57 | 5 | 0 | 0 | 0 | 1 | 63 |
| 3 | BIRBHUM | 6 | 92 | 0 | 0 | 0 | 69 | 167 |
| 4 | DAKSHIN DINAJPUR | 9 | 9 | 0 | 0 | 13 | 0 | 31 |
| 5 | DARJEELING | 1 | 189 | 0 | 0 | 0 | 39 | 229 |
| 6 | HAORA | 1 | 0 | 0 | 0 | 0 | 0 | 1 |
| 7 | JALPAIGURI | 117 | 2852 | 0 | 0 | 10 | 314 | 3293 |
| 8 | KOCH BEHAR | 12 | 428 | 0 | 0 | 472 | 186 | 1098 |
| 9 | MALDA | 6 | 54 | 0 | 0 | 0 | 0 | 60 |
| 10 | MURSHIDABAD | 2 | 0 | 0 | 0 | 0 | 0 | 2 |
| 11 | NADIA | 15 | 7 | 0 | 0 | 0 | 1 | 23 |
| 12 | NORTH 24 PARGANAS | 11 | 20 | 0 | 0 | 0 | 2 | 33 |
| 13 | PASHCHIM MIDNAPORE | 64 | 1545 | 0 | 0 | 10 | 792 | 2411 |
| 14 | PURBA MIDNAPORE | 0 | 1 | 0 | 0 | 0 | 0 | 1 |
| 15 | PURULIA | 2 | 122 | 0 | 0 | 3272 | 215 | 3611 |
| 16 | UTTAR DINAJPUR | 2 | 66 | 0 | 0 | 6 | 5 | 79 |
| Total : | 314 | 6042 | 0 | 0 | 4271 | 1840 | 12467 | |
DISTRIBUTION OF SHALLOW TUBEWELLS ACCORDING TO SOURCE OF ENERGY
|
State Name : WEST BENGAL |
||||||||
| Sl.No | Name of District | Electric Pump | Diesel Pump | Wind Mills | Solar Pumps | Manual/ Animal | Others | Total |
| 1 | BANKURA | 3907 | 13118 | 0 | 0 | 0 | 561 | 17586 |
| 2 | BARDDHAMAN | 15637 | 16879 | 0 | 0 | 0 | 1407 | 33923 |
| 3 | BIRBHUM | 7600 | 2788 | 0 | 0 | 0 | 591 | 10979 |
| 4 | DAKSHIN DINAJPUR | 3055 | 20452 | 0 | 0 | 0 | 404 | 23911 |
| 5 | DARJEELING | 20 | 834 | 0 | 0 | 0 | 181 | 1035 |
| 6 | HAORA | 220 | 298 | 0 | 0 | 0 | 52 | 570 |
| 7 | HOOGHLY | 10093 | 4920 | 0 | 0 | 0 | 517 | 15530 |
| 8 | JALPAIGURI | 218 | 5824 | 0 | 0 | 0 | 1212 | 7254 |
| 9 | KOCH BEHAR | 1725 | 38787 | 0 | 0 | 0 | 707 | 41219 |
| 10 | MALDA | 2284 | 23265 | 0 | 0 | 0 | 154 | 25703 |
| 11 | MURSHIDABAD | 11837 | 54841 | 0 | 0 | 0 | 1399 | 68077 |
| 12 | NADIA | 11385 | 82462 | 0 | 0 | 0 | 500 | 94347 |
| 13 | NORTH 24 PARGANAS | 5145 | 46280 | 0 | 0 | 0 | 633 | 52058 |
| 14 | PASHCHIM MIDNAPORE | 11418 | 32838 | 0 | 0 | 0 | 3821 | 48077 |
| 15 | PURBA MIDNAPORE | 5069 | 4813 | 0 | 0 | 0 | 220 | 10102 |
| 16 | PURULIA | 1 | 12 | 0 | 0 | 0 | 2 | 15 |
| 17 | SOUTH 24 PARGANAS | 335 | 6503 | 0 | 0 | 0 | 33 | 6871 |
| 18 | UTTAR DINAJPUR | 1372 | 42754 | 0 | 0 | 0 | 393 | 44519 |
| Total : | 91321 | 397668 | 0 | 0 | 0 | 12787 | 501776 | |
DISTRIBUTION OF DEEP TUBEWELLS ACCORDING TO SOURCE OF ENERGY
|
State Name : WEST BENGAL |
||||||||
| Sl.No | Name of District | Electric Pump | Diesel Pump | Wind Mills | Solar Pumps | Manual/ Animal | Others | Total |
| 1 | BANKURA | 156 | 0 | 0 | 0 | 0 | 12 | 168 |
| 2 | BARDDHAMAN | 634 | 1 | 0 | 0 | 0 | 20 | 655 |
| 3 | BIRBHUM | 114 | 0 | 0 | 0 | 0 | 22 | 136 |
| 4 | DAKSHIN DINAJPUR | 152 | 0 | 0 | 0 | 0 | 2 | 154 |
| 5 | DARJEELING | 4 | 0 | 0 | 0 | 0 | 0 | 4 |
| 6 | HAORA | 199 | 0 | 0 | 0 | 0 | 21 | 220 |
| 7 | HOOGHLY | 522 | 0 | 0 | 0 | 0 | 30 | 552 |
| 8 | JALPAIGURI | 160 | 0 | 0 | 0 | 0 | 24 | 184 |
| 9 | KOCH BEHAR | 74 | 0 | 0 | 0 | 0 | 4 | 78 |
| 10 | MALDA | 356 | 0 | 0 | 0 | 0 | 21 | 377 |
| 11 | MURSHIDABAD | 541 | 0 | 0 | 0 | 0 | 91 | 632 |
| 12 | NADIA | 734 | 0 | 0 | 0 | 0 | 59 | 793 |
| 13 | NORTH 24 PARGANAS | 357 | 0 | 0 | 0 | 0 | 24 | 381 |
| 14 | PASHCHIM MIDNAPORE | 385 | 0 | 0 | 0 | 0 | 22 | 407 |
| 15 | PURBA MIDNAPORE | 160 | 0 | 0 | 0 | 0 | 27 | 187 |
| 16 | SOUTH 24 PARGANAS | 49 | 0 | 0 | 0 | 0 | 22 | 71 |
| 17 | UTTAR DINAJPUR | 173 | 0 | 0 | 0 | 0 | 24 | 197 |
| Total : | 4770 | 1 | 0 | 0 | 0 | 425 | 5196 | |
DISTRIBUTION OF SURFACE LIFT SCHEMES ACCORDING TO SOURCE OF ENERGY
|
State Name : WEST BENGAL |
||||||||
| Sl.No | Name of District | Electric Pump | Diesel Pump | Wind Mills | Solar Pumps | Manual/ Animal | Others | Total |
| 1 | BANKURA | 89 | 1430 | 0 | 0 | 952 | 162 | 2633 |
| 2 | BARDDHAMAN | 188 | 1981 | 0 | 0 | 40 | 68 | 2277 |
| 3 | BIRBHUM | 86 | 7943 | 0 | 0 | 765 | 1887 | 10681 |
| 4 | DAKSHIN DINAJPUR | 31 | 1108 | 0 | 0 | 23 | 25 | 1187 |
| 5 | DARJEELING | 16 | 88 | 0 | 0 | 0 | 39 | 143 |
| 6 | HAORA | 81 | 3350 | 0 | 0 | 14 | 2788 | 6233 |
| 7 | HOOGHLY | 211 | 1674 | 0 | 0 | 0 | 502 | 2387 |
| 8 | JALPAIGURI | 81 | 470 | 0 | 0 | 1 | 188 | 740 |
| 9 | KOCH BEHAR | 49 | 496 | 0 | 0 | 10 | 75 | 630 |
| 10 | MALDA | 138 | 1912 | 0 | 0 | 36 | 201 | 2287 |
| 11 | MURSHIDABAD | 224 | 1073 | 0 | 0 | 54 | 274 | 1625 |
| 12 | NADIA | 171 | 161 | 0 | 0 | 0 | 29 | 361 |
| 13 | NORTH 24 PARGANAS | 87 | 627 | 0 | 0 | 5 | 71 | 790 |
| 14 | PASHCHIM MIDNAPORE | 228 | 2350 | 0 | 0 | 5 | 361 | 2944 |
| 15 | PURBA MIDNAPORE | 204 | 2829 | 0 | 0 | 2 | 75 | 3110 |
| 16 | PURULIA | 25 | 129 | 0 | 0 | 307 | 78 | 539 |
| 17 | SOUTH 24 PARGANAS | 79 | 7725 | 0 | 0 | 2064 | 78 | 9946 |
| 18 | UTTAR DINAJPUR | 18 | 199 | 0 | 0 | 0 | 23 | 240 |
| Total : | 2006 | 35545 | 0 | 0 | 4278 | 6924 | 48753 | |
District Level Abstract of Tanks
|
State Name : WEST BENGAL |
||||
| Sl.No | District | No. of Tanks used for Irrigation Purpose | No. of Tanks used for Non-Irrigation Purpose | Total |
| 1 | BANKURA | 10955 | 16752 | 27707 |
| 2 | BARDDHAMAN | 3039 | 46891 | 49930 |
| 3 | BIRBHUM | 12330 | 26585 | 38915 |
| 4 | DAKSHIN DINAJPUR | 1074 | 16787 | 17861 |
| 5 | DARJEELING | 254 | 246 | 500 |
| 6 | HAORA | 3262 | 32162 | 35424 |
| 7 | HOOGHLY | 2100 | 32997 | 35097 |
| 8 | JALPAIGURI | 1440 | 993 | 2433 |
| 9 | KOCH BEHAR | 1149 | 3786 | 4935 |
| 10 | MALDA | 3935 | 8884 | 12819 |
| 11 | MURSHIDABAD | 5599 | 15996 | 21595 |
| 12 | NADIA | 974 | 5631 | 6605 |
| 13 | NORTH 24 PARGANAS | 3143 | 33873 | 37016 |
| 14 | PASHCHIM MIDNAPORE | 6409 | 51656 | 58065 |
| 15 | PURBA MIDNAPORE | 14592 | 196591 | 211183 |
| 16 | PURULIA | 14044 | 8660 | 22704 |
| 17 | SOUTH 24 PARGANAS | 11290 | 92861 | 104151 |
| 18 | UTTAR DINAJPUR | 1437 | 5104 | 6541 |
| Total : | 97026 | 596455 | 693481 | |